Related Content
Inspiring golfers to pursue this great game with drive and passion
Keywords

Golf has always had its rules of thumb—play away from trouble, aim for the middle, take your medicine. Now those ideas are being backed (or challenged) by data, with shot patterns and strokes gained offering a more precise way to think about target selection. But as those concepts make their way into mainstream instruction, the line between smart strategy and overcorrection isn’t always as clear as it seems.
In the latest "Game Plan" segment, Luke Kerr-Dineen of Golf Digest breaks down the data-driven strategies tour players use to gain an edge with their approach shot targeting—and how everyday golfers can apply those same ideas. He goes next-level in identifying areas around the green that may play harder or easier than they first to help refine your target strategy. These are likely fractional differences that might only come up a few times a round, but accounting for them to make an informed decision can help lower your scoring average over time.
Understanding Shot Dispersion
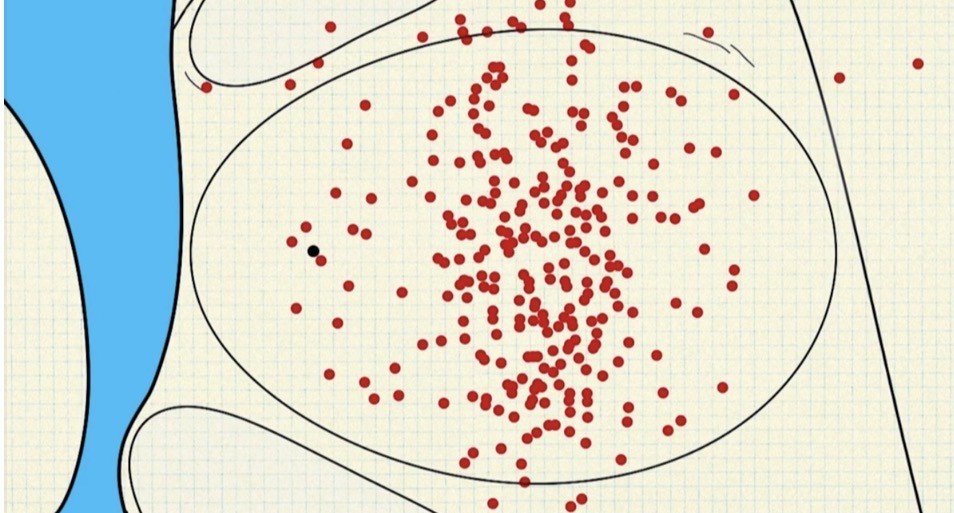
Luke covers some basics of shot dispersion patterns and how you can use them to dictate your target strategy. In the video, he uses an example shot dispersion pattern for a typical 10-handicap from 150 yards over different holes with varied hazards and pin placements.
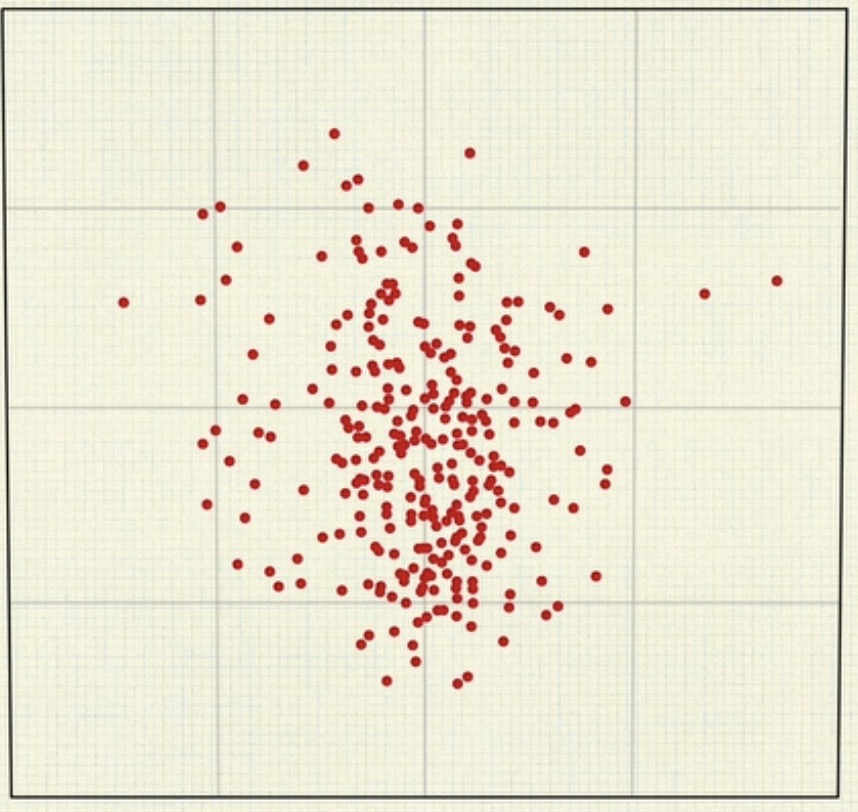
The one thing you'll notice—and that he points out in the video—is that the shots are distributed more closely toward the center, with misses scattered further away. I always assumed this was well understood, but the video describes this as a relatively new discovery.
It’s likely a byproduct of the launch monitor era, but typically shot patterns are represented as an oval capturing either all or nearly all (typically 95%) shots to a given target. The 95% confidence interval means that only one out of 20 shots would be expected to fall outside the shot pattern. This 95% confidence ellipse borrows from the stats world as a 2D visualization of the uncertainty around two related variables—in this case, distance dispersion (short and long) and lateral dispersion (left and right).
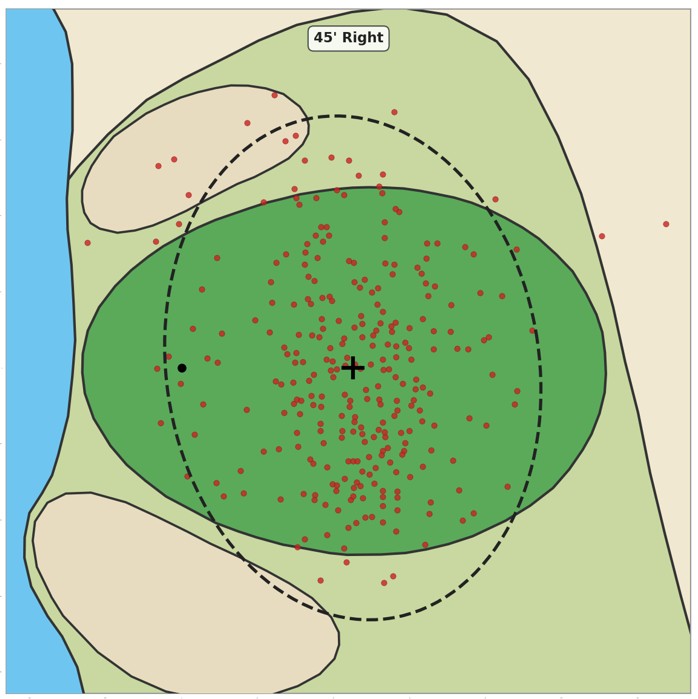
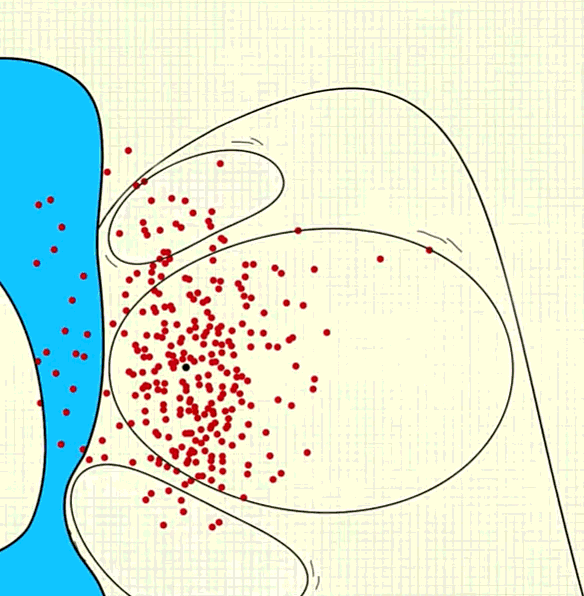
These misses are correlated. For a right-handed golfer, weak misses are typically going to end up short and right, and long misses are more likely a result of a closed clubface and go long and left. It’s this correlation that gives shot patterns their “tilt.” In the video, they simplified their illustration by using an 80-foot radius circle to represent the shot pattern, but below is the real 95% ellipse of the shots they plotted in the visualization.
The Myth of Random Misses
I want to focus on the distribution density of the shot pattern. As I mentioned earlier, I always assumed it was well understood that shots are more concentrated toward the middle. It’s either a lack of understanding of how misses work, or perhaps a myth or misinterpretation of course management principles, but aiming away from the hole absolutely will lead to fewer shots ending up close to the hole in the long run.
There seems to be a belief in some golf circles that shots randomly end up somewhere within the shot pattern, so even if you aim away from the flag, you’d still get the same number of birdie looks as long as the pin is somewhere inside that pattern.
This couldn’t be further from the truth.
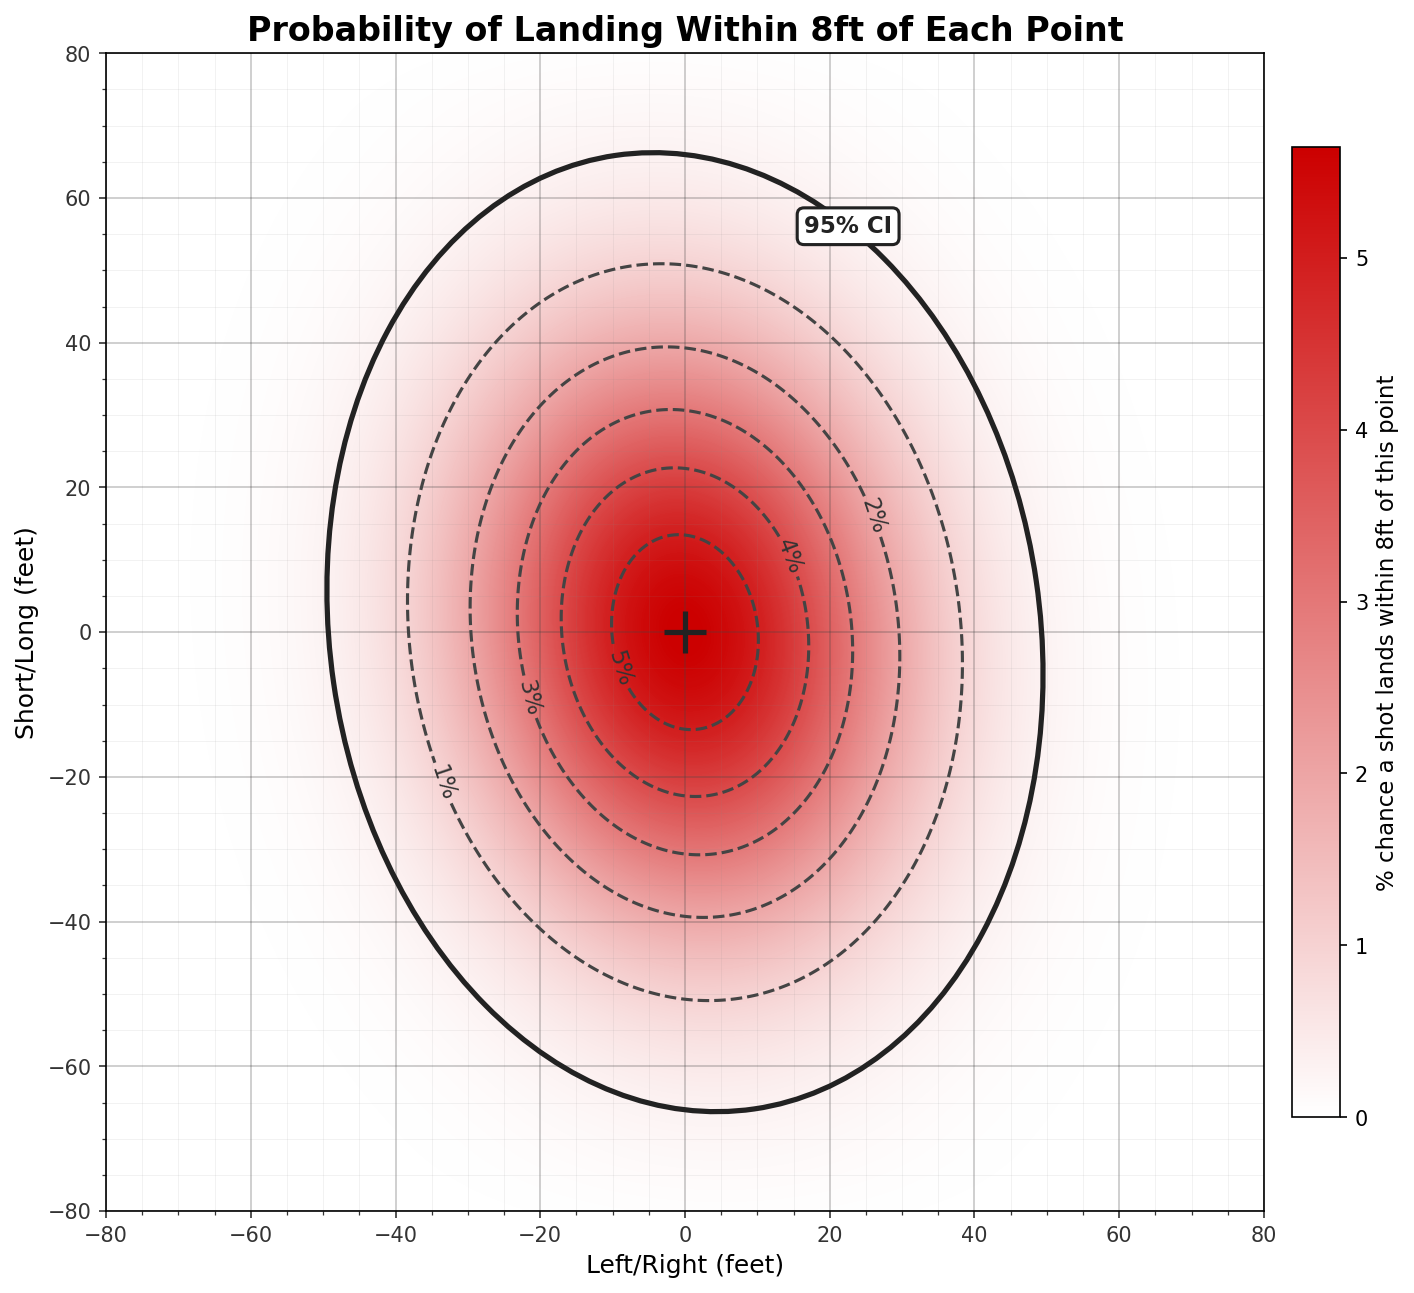
In the example above, the black dot marking the pin is 45 feet from the center of the shot pattern of this golfer aiming conservatively right. The visualization shows just how few birdie opportunities that would produce. Of course, those are just example dots, but if you use the shape of the shot pattern and then simulate millions of shots using those same parameters, you would get a chart showing the percentage of shots that end up within eight feet (i.e., a good birdie look) of any given position. You’ll notice the center is the highest (about 5.6% for this example), and by the time you get out to 45 feet left of the target, it drops to around 0.5% or less.
The “Three-Bucket” Strategy
Kerr-Dineen introduces a “three-bucket strategy” that incorporates the shot pattern and this bell-curve phenomenon for picking better targets into greens. According to the video, you can think of shots as being within one standard deviation (68% of shots), one-to-two standard deviations (27%), and beyond two standard deviations (the remaining 5%).
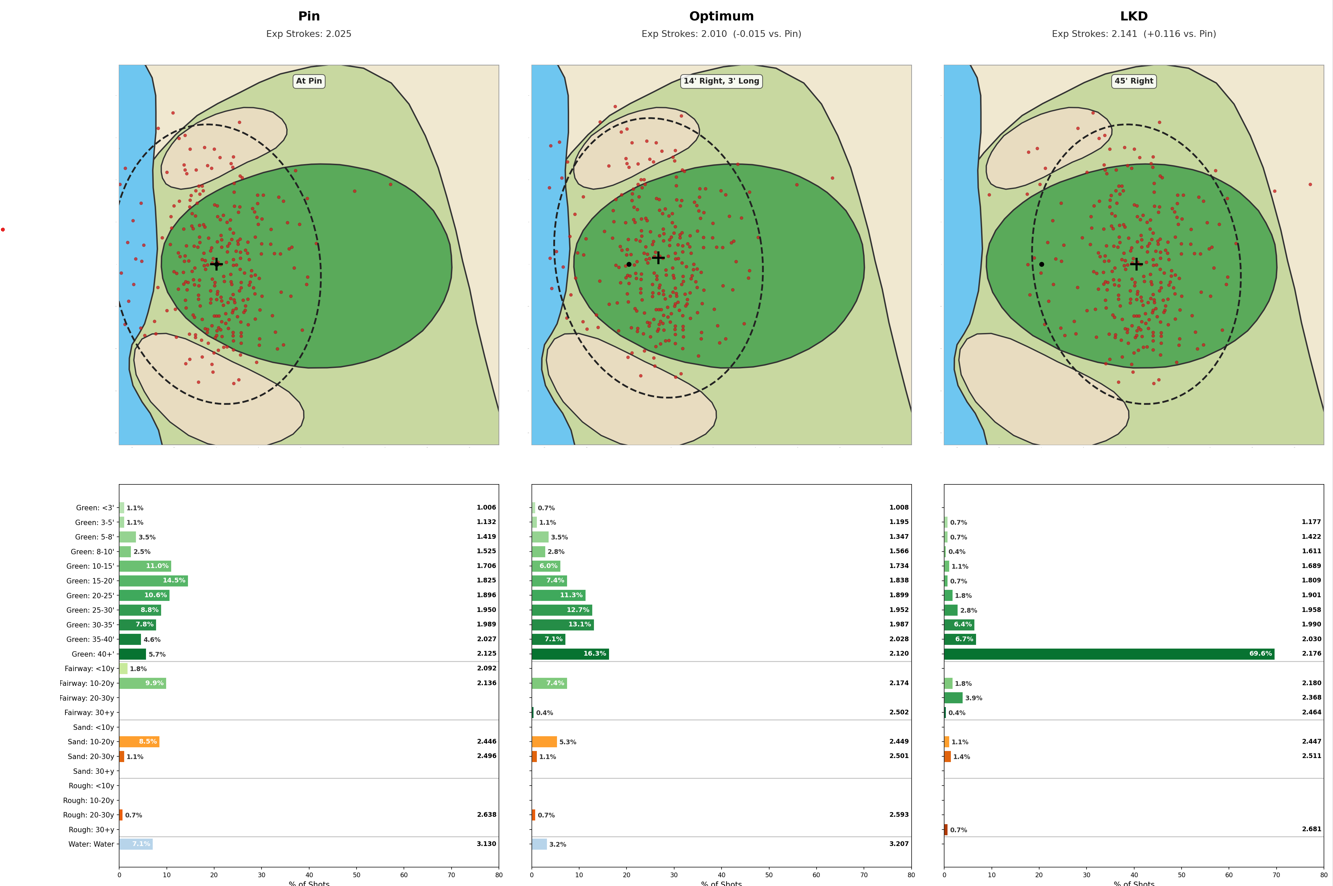
LKD suggests concentrating on the 95% of shots (the ellipse) and picking targets that avoid hazards while keeping the bulk of the shot pattern in safe areas. The video uses an example hole with water left and the same 150-yard shot pattern.
According to Kerr-Dineen, “the way to avoid these [penalty hazards] is simple. You simply aim away from them. You find the side that the hazard is on and you sacrifice some of the good shots from bucket one to make sure your bucket two shots are mostly okay.”
It’s hard to argue with that logic. But then the video goes on to show the shot pattern moving 45 feet right to the middle of the green.
Putting the Strategy to the Test
Now we could give LKD the benefit of the doubt and chalk it up as merely an illustrative example of an otherwise sound concept. Or we could dig deeper and see if this strategy has legs.
Given he prefaced this section by saying, “the 25% of shots in the average-to-bad bucket is the interesting bit, because that’s where you can get cute and clever, as long as you do it right—and here’s how,” then it should be able to withstand additional scrutiny.
Using the shot dots, the earlier reference to a 40-foot dispersion, and the grid, we can estimate that this green is about 46 yards wide and 32 yards deep, with the pin cut about 8–9 paces off the left side. We aren’t making any assumptions about slopes on or around the green; we can assume they do not bias expected strokes in any meaningful way.
For simplicity, assume that any shot left of the hazard line is in the water. Any shots that end up in the water are dropped from the water’s edge, which in this case is a fairway lie.
Using the Tour’s strokes gained expectations, we can calculate expected strokes for each shot location based on distance to the hole, lie, and—when missing the green—the degree of short-sidedness. Shots in the water receive a penalty stroke plus the expected strokes from the drop location.
The Results: Conservative can be Costly
The answer might surprise you.
In a video arguing for nuanced decision-making that can save hundredths of strokes, the “here’s how” example of avoiding penalty hazards aims so conservatively that it would cost more than a tenth of a stroke compared to simply aiming at the pin.
Any benefit gained from eliminating water balls is more than offset by having almost no birdie opportunities and nearly 70% of shots finishing 40 feet or more from the hole. You’re essentially trading penalties for three-putts while also sacrificing birdie chances.
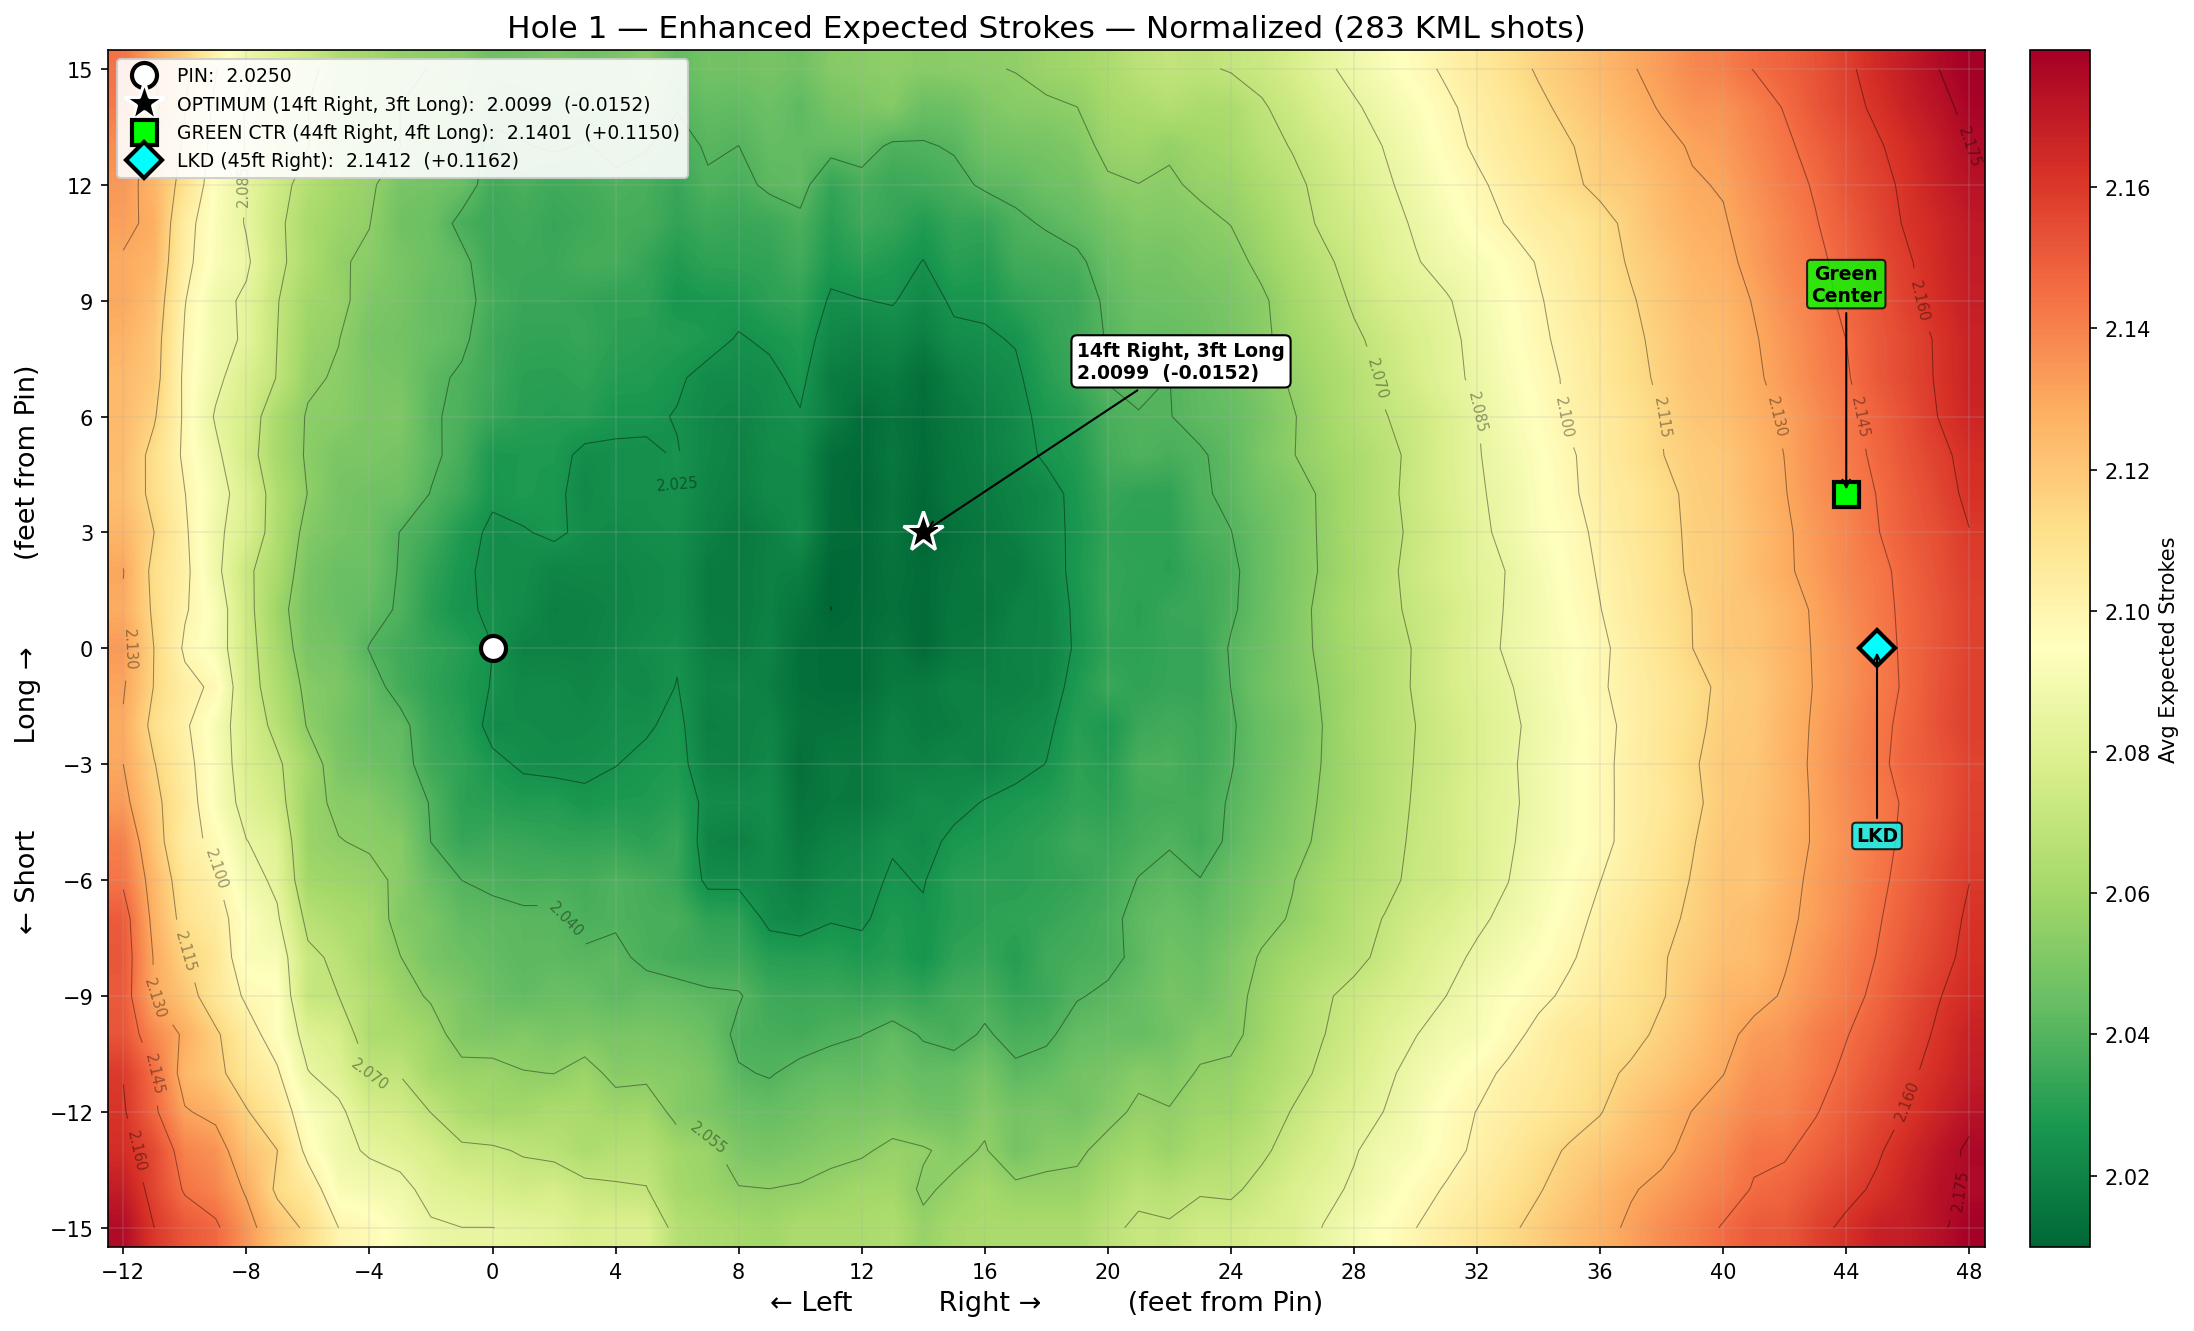
The second panel shows the true optimal target: 14 feet right of the pin and three feet long. That yields expected strokes just 0.015 lower than aiming directly at the pin—but that’s equivalent to about 0.27 strokes per round.
To further illustrate this, we calculated that you could aim 12 feet left of this pin and still be better off than aiming 45 feet right. We can all agree that aiming left of a pin with water left qualifies as a bad idea, but it’s still a better idea than aiming that far away from the hole.
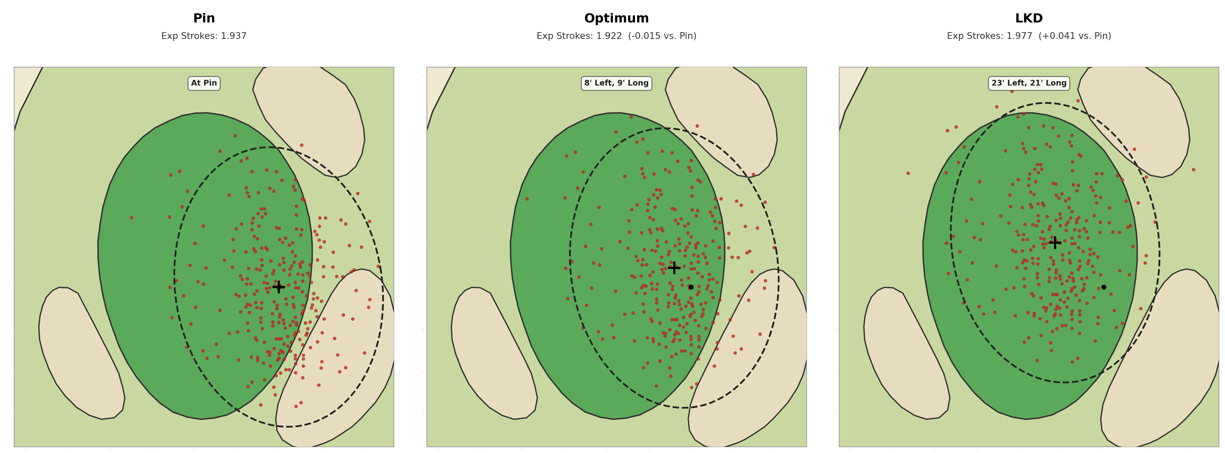
A Second Example, Same Issue
The video presents a second hole with no water but a pin tucked behind a front-right bunker. Our calculations show an optimal target eight feet left and nine feet long.
Again, the video’s suggested target is excessively conservative to the point that it does more harm than good. A golfer could aim five feet closer to the bunker—something no one would advocate—and still be better off than aiming that far away from the hole.
Conclusion: Be Careful What You Aim For
The illustrative examples in the video are misleading at best and flat-out wrong at worst. But the foundation—understanding your shot pattern, recognizing hazards, evaluating lies and slopes, and incorporating all of that into your target strategy—is absolutely worthwhile. To his credit, Luke points out that the conservative play is not always the best play.
Ultimately, the optimal strategy is player-specific, based not only on approach play but also on short-game profile. That’s why our DG Insider Tier includes target optimization and disciplined target practice heading into tournament weeks, fully customized to a player’s skill profile. For example, in the 2nd hole example above, imagine that the player is a sub-par bunker player. Every bunker this player hits in is effectively a +.25 stroke penalty vs. tour average. The optimal target for this player would be an additional 5 feet away from the hazard.
Free E-mail Newsletter
Subscribe to the DRVN.Golf Newsletter
DRVN.Golf in your inbox, every month